Portfolio Project
JobBoard — Distributed Systems Platform
A full-stack, multi-tenant platform demonstrating real-world legacy-to-cloud migration with enterprise architecture patterns, AI integration, and production-grade observability. Three architectural paths running side-by-side with 20 Architecture Decision Records documenting every trade-off.
Architecture Highlights
Clean Architecture + DDD
Domain model with factory methods, value objects returning Result<T>, and strict dependency flow.
CQRS + Decorator Pipeline
Custom decorator chain (not MediatR) with auth, observability, validation, and transaction decorators.
Legacy Modernization
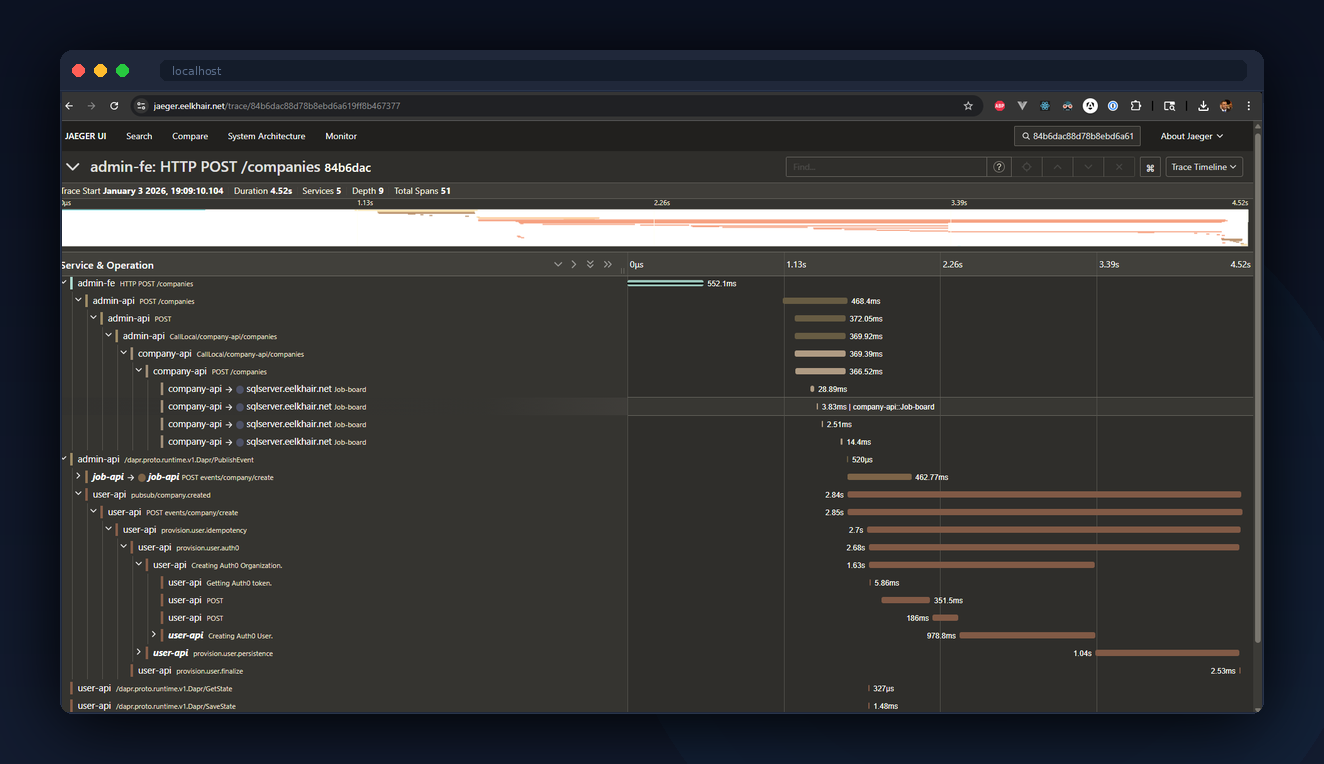
Incremental migration using the Strangler-Fig pattern with bidirectional sync. Both architectures run simultaneously — toggle in the toolbar and trace the difference in Jaeger.
AI Multi-Provider
OpenAI, Claude, and Gemini with scoped tool registries (SystemAdmin/Admin/Public), MCP servers, and per-session tool resolution.
Resume RAG Pipeline
Event-driven parsing, pgvector embeddings (1536-dim), and cosine similarity matching.
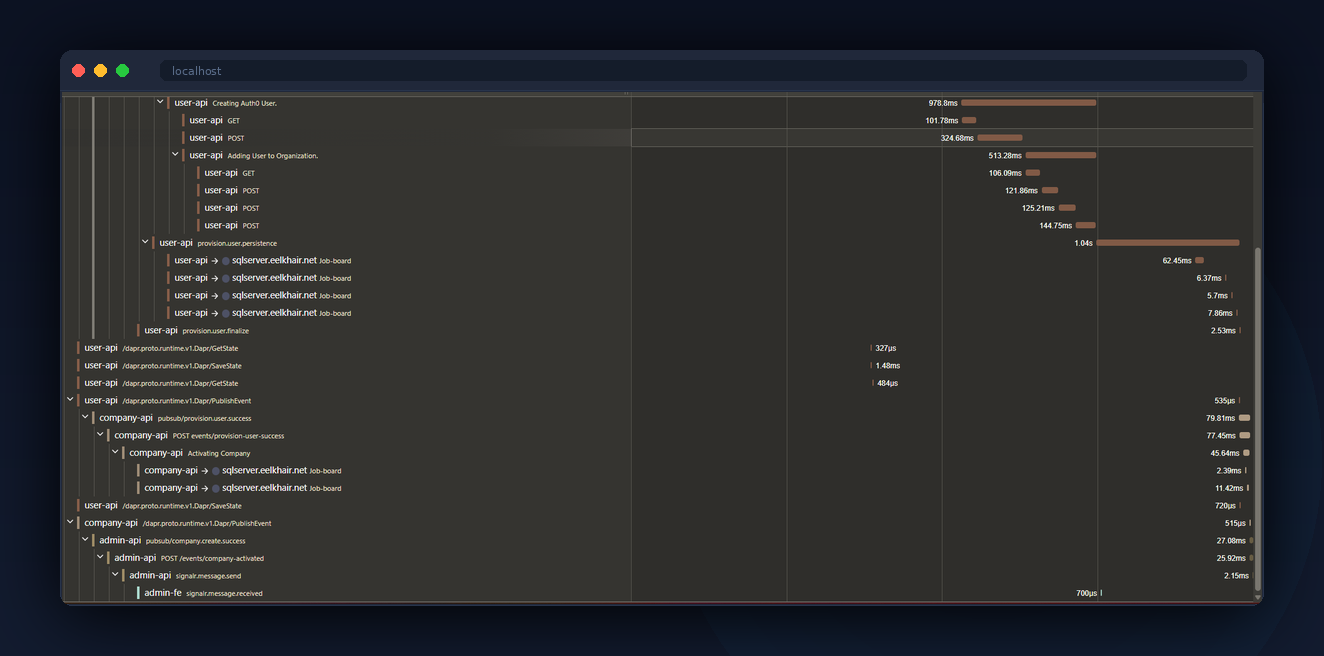
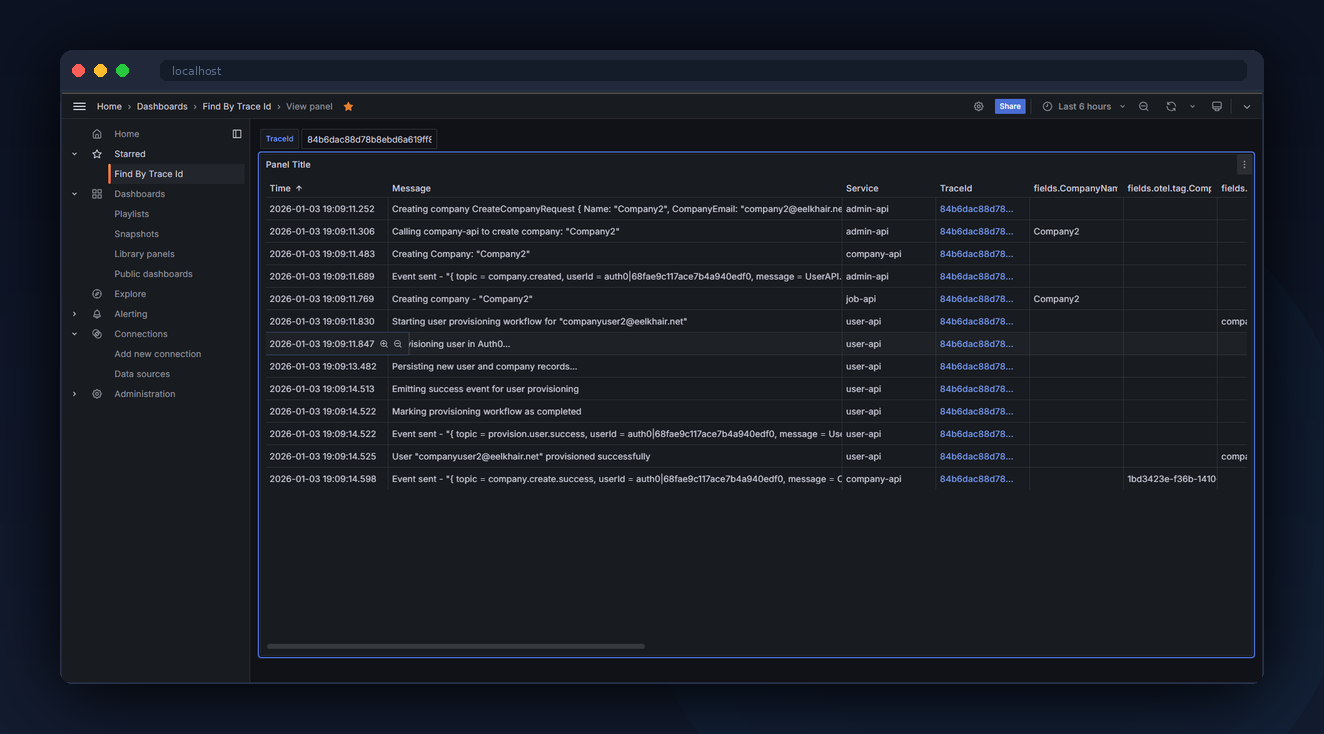
Distributed Tracing
End-to-end OpenTelemetry spans from browser through APIs, messaging, and background processors.
Transactional Outbox
Events written atomically with state changes. UPDLOCK/READPAST locking, retries, and dead-letter handling.
Azure + Homelab
Bicep IaC for Azure Container Apps. Same codebase runs on Proxmox homelab via Cloudflare Tunnel.
Tech Stack
Live Demo
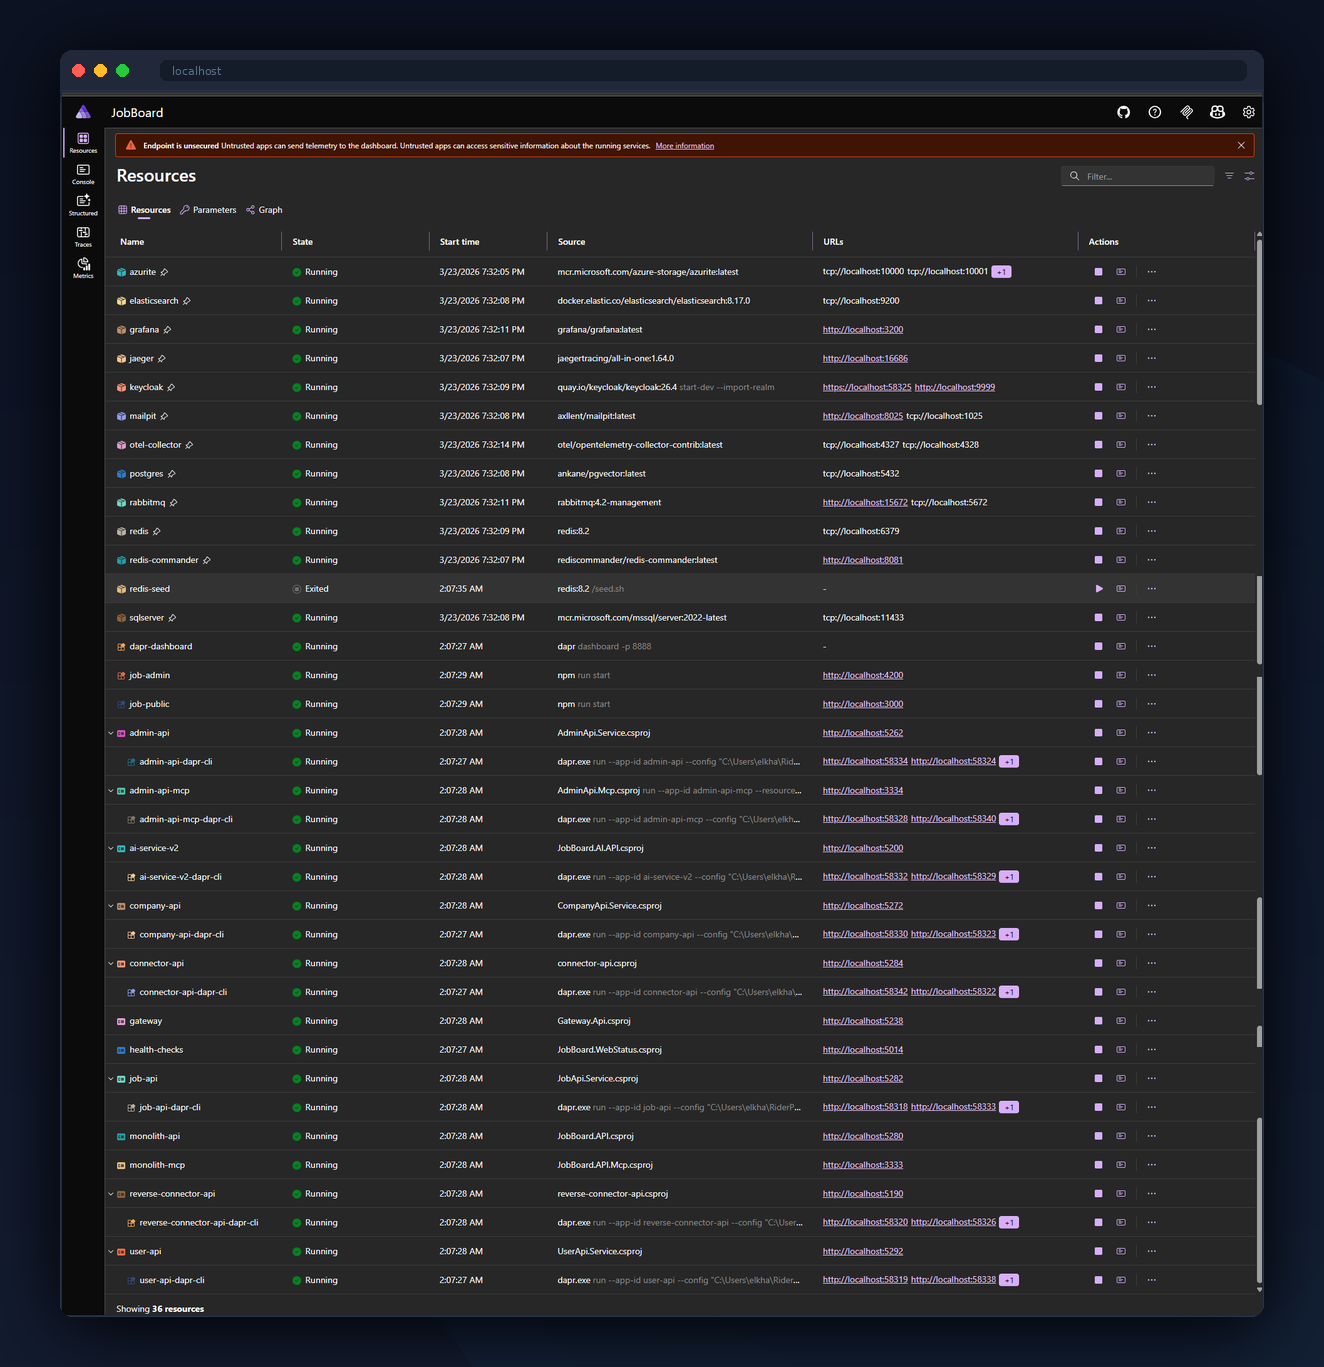
Running Services
All services are running on a self-hosted Proxmox homelab, exposed via Cloudflare Tunnel.
1. Transport: Streamable HTTP
2. URL: https://mono-mcp.elkhair.tech
3. Connection Type: Direct
4. Click Connect
5. Go to the Tools tab to browse AI tools
Deep Dives
Case Studies
Each case study covers a specific engineering topic: the problem, the solution, architecture decisions, and tradeoffs.
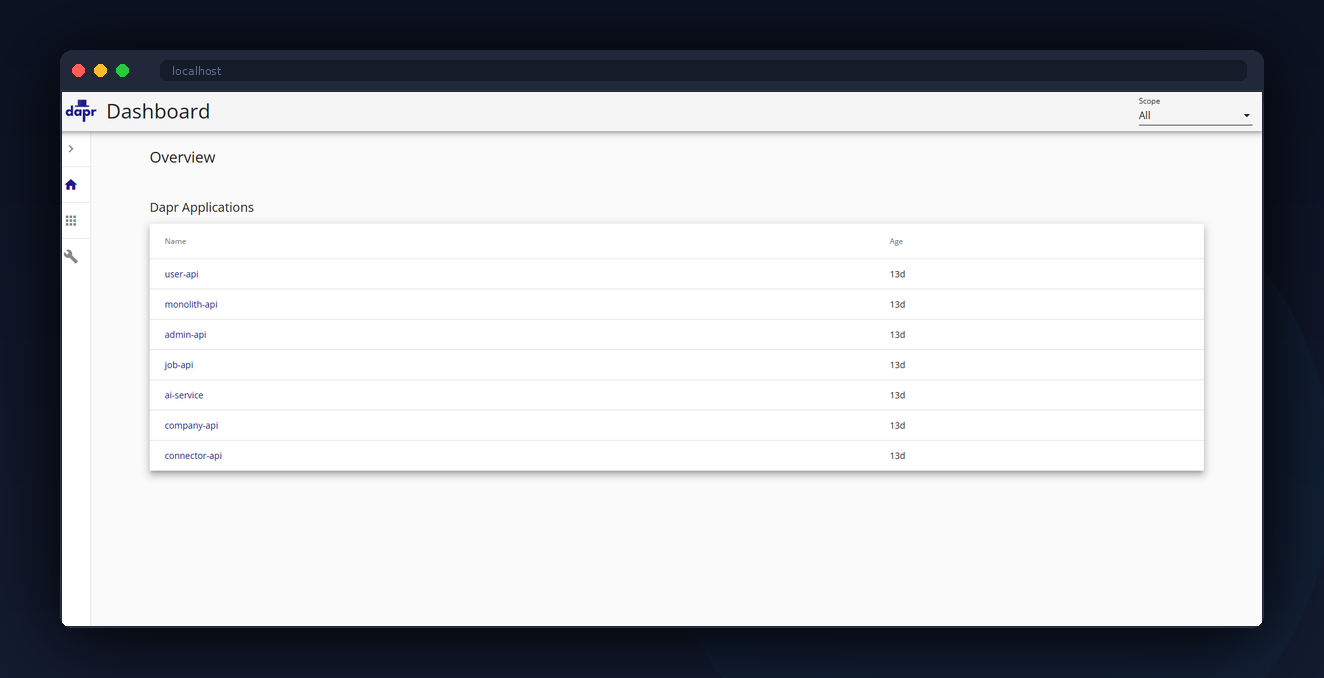
Architecture Overview
Monolith vs microservices, YARP gateway routing, Dapr sidecars, and the strangler-fig migration strategy with bidirectional sync.
AI Orchestration
Multi-provider LLM chat, MCP server tool discovery, scoped tool registries, and an event-driven resume RAG pipeline with pgvector.
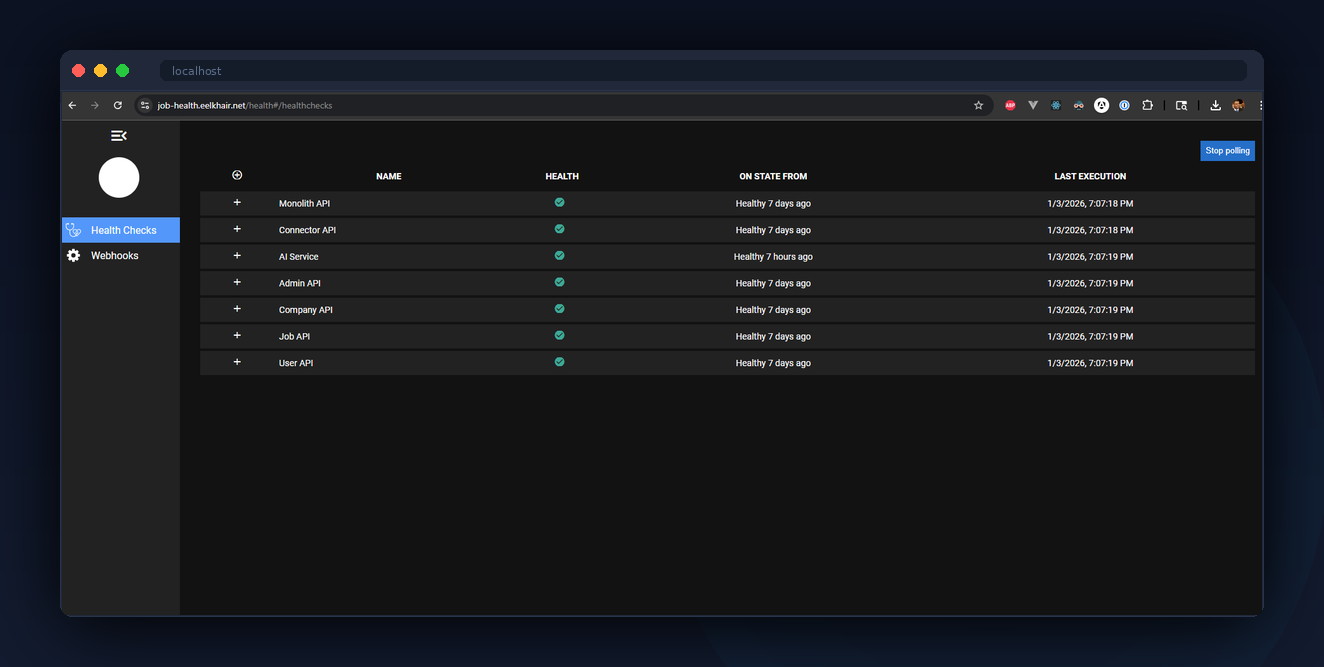
Observability
Distributed tracing with Jaeger, Grafana dashboards, health checks, and OpenTelemetry instrumentation across 16 services.
Homelab Infrastructure
Self-hosted Proxmox cluster, Cloudflare Tunnel with declarative edge config, private Docker registry, and a one-command Aspire local environment.
Architecture Decision Records
20 ADRs documenting every significant trade-off: context, alternatives considered, and rationale for each decision.
Getting Started
How to Explore This Project
Jump into the live apps and try the key features. Each action generates real distributed traces you can inspect.
Admin App
Toggle between Monolith & Microservices, create companies & jobs, use AI chat with function calling, and check distributed traces in Jaeger.
Public App
Browse jobs, upload a resume and watch AI parse it in real-time via SignalR, apply to jobs, and ask the AI for job recommendations.
Jaeger
View distributed traces across all 16 services. See complete request flows from gateway through monolith or microservices to the AI service.
Grafana
Dashboards for API latency, error rates, and throughput. Compare monolith vs microservices performance side-by-side.
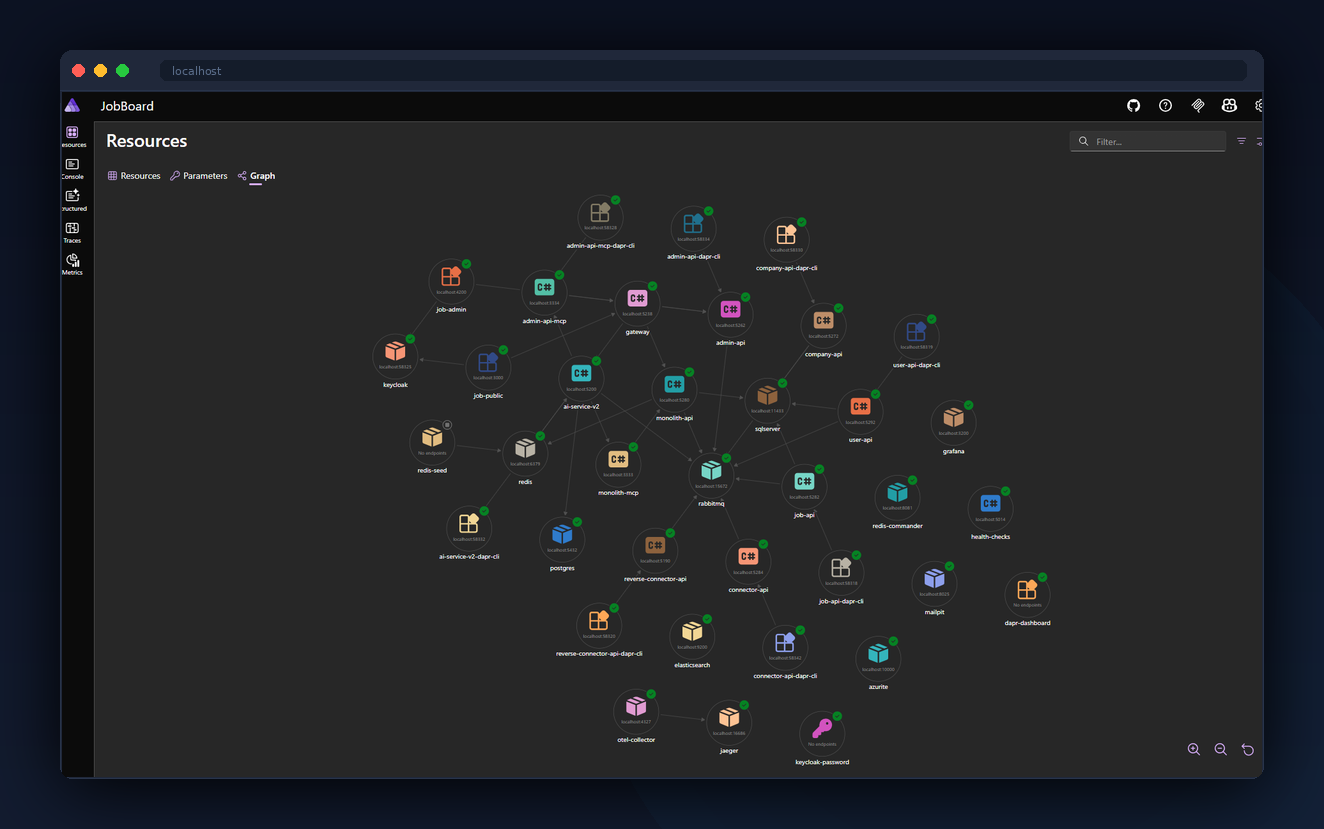
System Architecture
How It All Connects
16 services across 4 architectural layers, orchestrated with Dapr sidecars and exposed via Cloudflare Tunnel.
Screenshots
The System in Action
Explore the platform's dashboards, traces, and infrastructure. Click any slide to enlarge.